


Standard Curve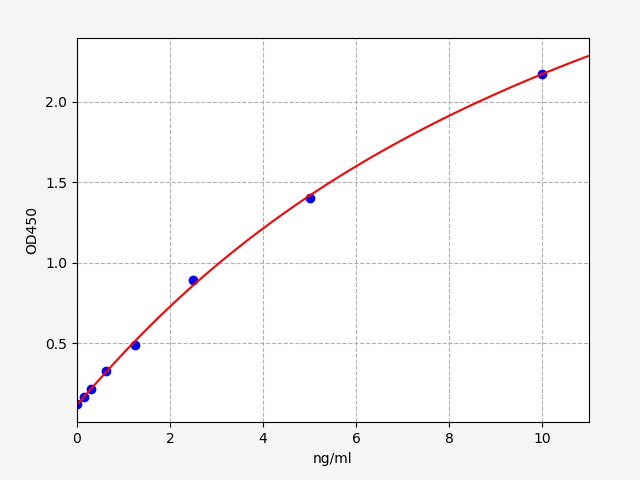 Storage4 ℃ for 6 monthsRecovery
Matrices listed below were spiked with certain level of CTHRC1 and the recovery rates were calculated by comparing the measured value to the expected amount of CTHRC1 in samples.
| Matrix | Recovery range(%) | Average(%) |
|---|---|---|
| serum(n=5) | 86-102 | 94 |
| EDTA plasma(n=5) | 89-104 | 97 |
| heparin plasma(n=5) | 88-104 | 93 |
The linearity of the kit was assayed by testing samples spiked with appropriate concentration of CTHRC1 and their serial dilutions. The results were demonstrated by the percentage of calculated concentration to the expected.
| Sample | 1:2 | 1:4 | 1:8 | 1:16 |
|---|---|---|---|---|
| serum(n=5) | 95-102% | 86-104% | 89-105% | 89-96% |
| EDTA plasma(n=5) | 82-92% | 84-97% | 82-96% | 82-95% |
| heparin plasma(n=5) | 86-100% | 81-91% | 81-99% | 80-88% |
Inter-Assay: CV<10%NoteFor Research Use Only


